
Patterns for Trading Success Price action trading, the art of interpreting market sentiment directly from price movements, empowers traders to make informed decisions. Candlestick patterns, visual representations of price dynamics, are fundamental to this approach. This comprehensive guide unveils eight crucial candlestick patterns, equipping you with the knowledge to decipher these signals and elevate your trading strategies.
Understanding the Building Blocks: Candlesticks
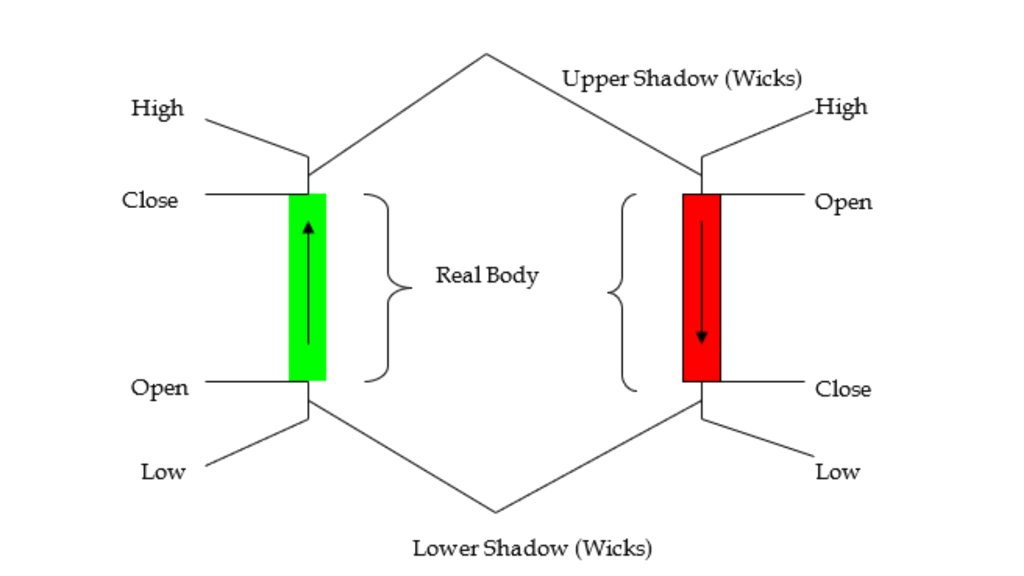
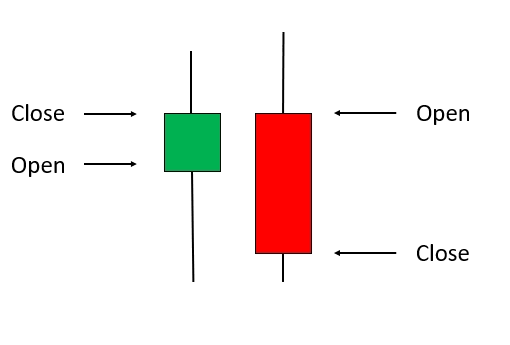
Before we delve into the patterns, let’s understand the anatomy of a candlestick. Each candle represents price action over a specific timeframe (e.g., a day, an hour). It comprises:
Body: The thicker part, representing the range between the opening and closing prices. A green (or white) body signifies a bullish close (close > open), while a red (or black) body indicates a bearish close (close < open).
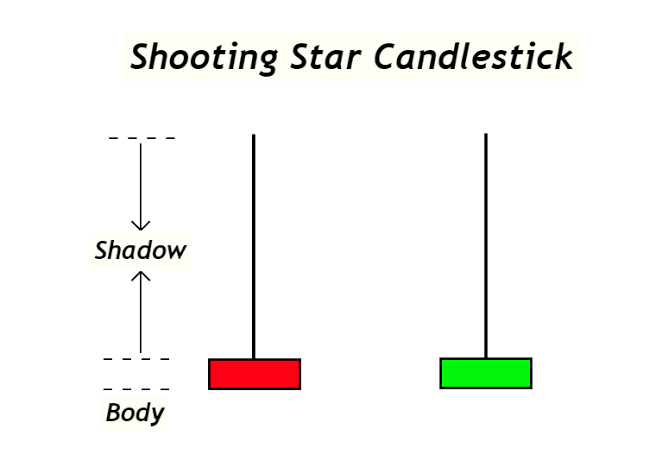
Wicks (or Shadows): The thin lines extending above and below the body, depicting the highest and lowest prices reached during that period.
The Eight Essential Candlestick Patterns:
We’ll categorize these patterns into bullish (signaling potential price increases) and bearish (signaling potential price decreases).
Bullish Candlestick Patterns:
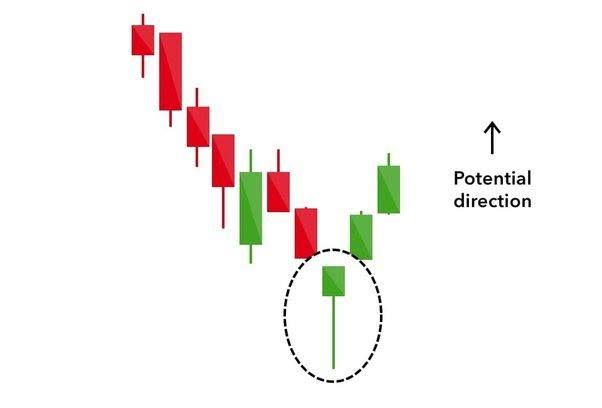
Hammer: A small body at the top of the candle with a long lower wick. It appears during a downtrend, suggesting potential buying pressure and a possible trend reversal.
Inverse Hammer: Similar to the Hammer, but the long wick is above the small body. Also found in downtrends, it hints at potential upward price movement.

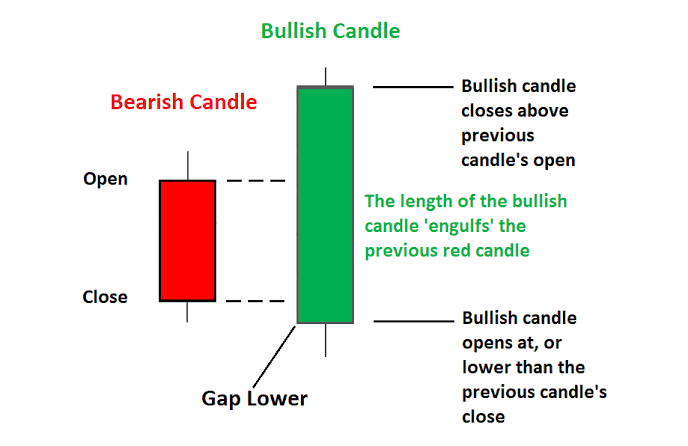
Bullish Engulfing: A smaller bearish candle is completely enveloped by a larger bullish candle. This signifies strong buying pressure overpowering previous selling momentum.
Morning Star: A three-candle pattern: a bearish candle, a doji (small body) or spinning top, and then a bullish candle. It signals a potential bottom and trend reversarrever

Bearish Candlestick Patterns:
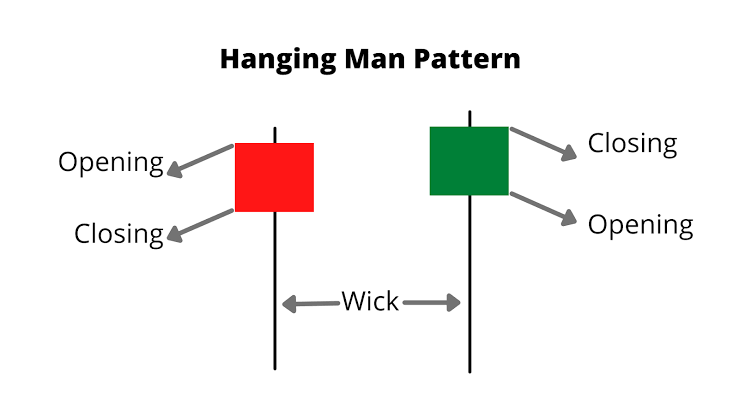
Hanging Man: A small body at the bottom of the candle with a long lower wick. It appears in an uptrend, suggesting potential selling pressure and a possible reversal.
Shooting Star: A small body at the top of the candle with a long upper wick. Found in uptrends, it indicates potential downward price movement.
Bearish Engulfing: A smaller bullish candle is completely engulfed by a larger bearish candle. This shows strong selling pressure overcoming prior buying momentum.
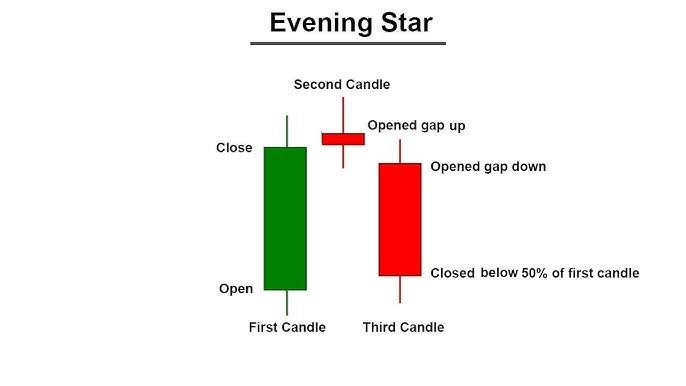
Evening Star: A three-candle pattern: a bullish candle, a doji or spinning top, and then a bearish candle. It signals a potential top and trend reversal.
Trading Strategies Using Candlestick Patterns:
Context is King: These patterns are most effective when analyzed within the broader market context. Consider the prevailing trend, support and resistance levels, and other technical indicators.
Confirmation is Key: Don’t trade solely based on a single candlestick pattern. Await confirmation, such as a break above the high of a bullish pattern or below the low of a bearish pattern.
Risk Management is Paramount: Always use stop-loss orders to mitigate potential losses. Never risk more capital than you can afford to lose.
Practice and Patience are Essential: Mastering candlestick patterns requires time and practice. Utilize a demo account or paper trading to refine your skills before risking real funds.
For More Knowledge Get UFET Price Action Mentorship – SMC Mentorship